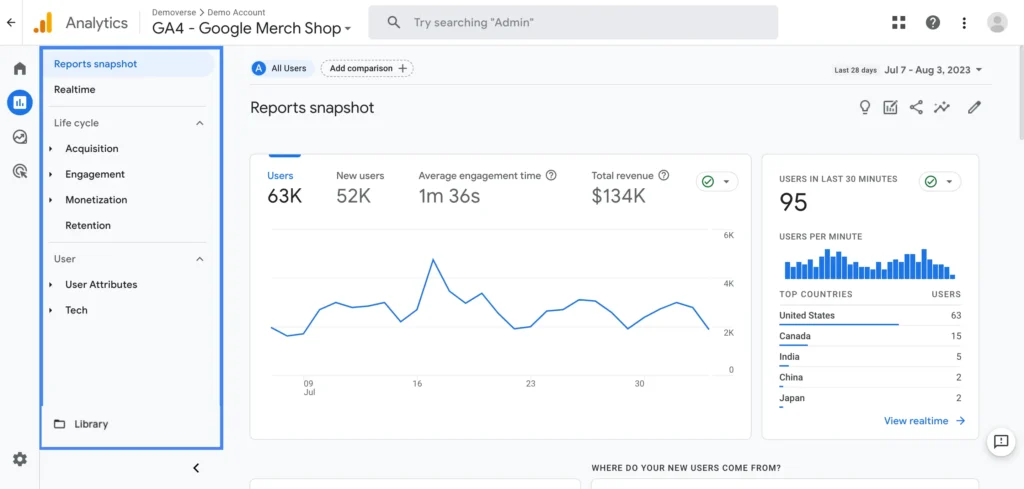
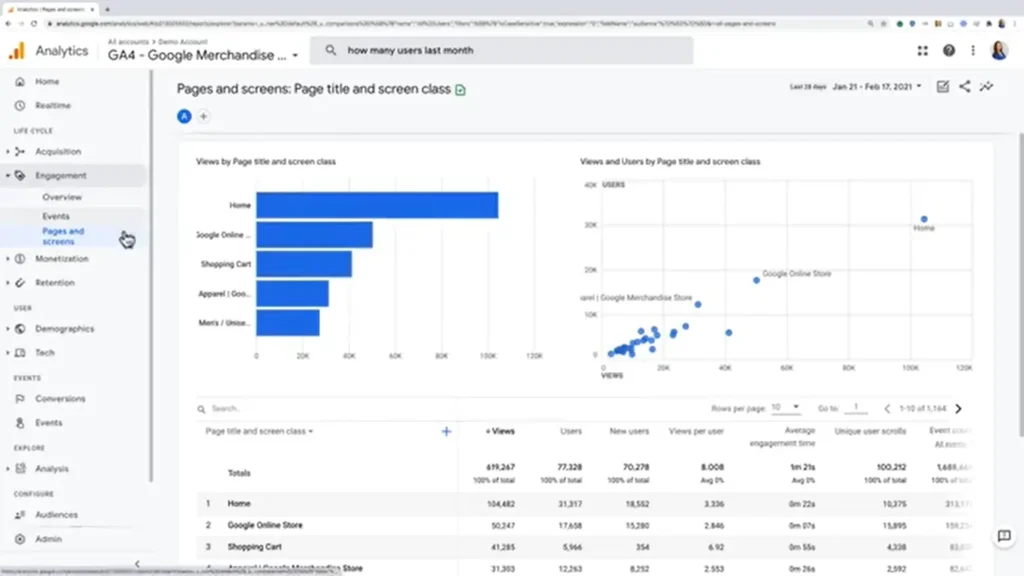
As a leading SEO agency in New York, Cyber Munk understands the critical role that data analysis plays in digital marketing success. One of the most powerful tools at our disposal is Google Analytics, and at its heart lies the dashboard. In this comprehensive guide, we’ll explore the five main sections of the Google Analytics dashboard and how they can help New York businesses make data-driven decisions to outperform their competitors.

Introduction: The Power of Google Analytics for New York Businesses
In the bustling digital marketplace of New York City, standing out is more challenging than ever. Whether you’re a trendy SoHo boutique, a financial services firm in the Financial District, or a home service provider in Queens, understanding your website’s performance is crucial. Google Analytics provides this insight, and its dashboard is the gateway to a wealth of information.
As an SEO agency New York businesses trust, we at Cyber Munk have helped countless local companies leverage Google Analytics to boost their online presence and drive growth. Let’s dive into the five main sections of the Google Analytics dashboard and discover how each can benefit your business.
1. Real-Time Reports: The Pulse of Your Website

What Are Real-Time Reports?
The Real-Time section of the Google Analytics dashboard provides up-to-the-minute data about visitor activity on your website. It’s like having a live feed of your digital storefront.
Key Features of Real-Time Reports:
- Overview: A snapshot of current active users, pageviews per minute, and top active pages.
- Locations: Geographic data of where your current visitors are located.
- Traffic Sources: Insights into how visitors are finding your site right now.
- Content: What pages are being viewed at this moment.
- Events: Real-time tracking of specific user interactions.
- Conversions: Live view of goal completions.
How New York Businesses Can Leverage Real-Time Reports:
Imagine you’re a Manhattan restaurant owner who’s just launched a new online booking system. With Real-Time reports, you can immediately see how many users are interacting with the new feature. This instant feedback is invaluable for quickly addressing any issues or capitalizing on sudden spikes in interest.
2. Audience Reports: Know Your Visitors

Understanding Audience Reports
The Audience section provides detailed information about who is visiting your website. It’s like having a comprehensive customer profile at your fingertips.
Key Features of Audience Reports:
- Demographics: Age and gender information about your visitors.
- Interests: Categories that represent your audience’s lifestyle and purchasing habits.
- Geo: Geographic data including language and location.
- Behavior: New vs. returning visitors, frequency of visits, and engagement.
- Technology: Devices, browsers, and networks used to access your site.
Applying Audience Reports to New York Businesses:
For a New York SEO agency like Cyber Munk, Audience reports are goldmines of information. Let’s say you’re a Brooklyn-based e-commerce site selling handmade jewelry. By analyzing your audience demographics and interests, you might discover that a significant portion of your visitors are environmentally conscious millennials. This insight could inform your product development, marketing strategies, and even the tone of your website content.
3. Acquisition Reports: Understand Your Traffic Sources

Decoding Acquisition Reports
The Acquisition section tells you how visitors are finding your website. It’s like tracking all the paths that lead customers to your digital doorstep.
Key Features of Acquisition Reports:
- All Traffic: Overview of channels driving traffic to your site.
- Google Ads: Detailed data if you’re running Google Ads campaigns.
- Search Console: Integration with Google Search Console for organic search insights.
- Social: Breakdown of traffic from various social media platforms.
- Campaigns: Analysis of your marketing campaign performance.
How New York Businesses Can Optimize Using Acquisition Reports:
As an SEO agency New York companies rely on, we often use Acquisition reports to fine-tune our strategies. For instance, if you’re a law firm in Manhattan, these reports might reveal that while you’re getting significant traffic from organic search, your social media efforts are lagging. This could prompt a reevaluation of your social media strategy or a doubling down on your successful SEO efforts.
4. Behavior Reports: Analyze User Interactions
Exploring Behavior Reports
The Behavior section provides insights into how users interact with your website. It’s like having a heat map of user activity across your digital space.
Key Features of Behavior Reports:
- Behavior Flow: Visual representation of the path users take through your site.
- Site Content: Data on which pages are most popular and engaging.
- Site Speed: Insights into how quickly your pages load.
- Site Search: Analysis of how visitors use your website’s search function.
- Events: Tracking of specific interactions like video plays or download clicks.
Leveraging Behavior Reports for New York Businesses:
In the fast-paced New York market, user experience can make or break a business. Let’s say you’re a tour company offering guided walks in Central Park. Behavior reports might show that visitors are spending a lot of time on your “Tour Schedule” page but not converting. This could indicate that the page needs optimization, perhaps by making booking options more prominent or simplifying the schedule display.
5. Conversion Reports: Measure Your Success
Unraveling Conversion Reports
The Conversions section is where you measure the success of your website in achieving its goals. It’s like having a scorecard for your digital objectives.
Key Features of Conversion Reports:
- Goals: Tracking of specific objectives you’ve set for your site.
- Ecommerce: Detailed sales data for online stores.
- Multi-Channel Funnels: Analysis of how different channels work together to create conversions.
- Attribution: Insights into which touchpoints are most valuable in the conversion process.
Maximizing Conversions for New York Businesses:
As a New York SEO agency, we’ve seen how powerful Conversion reports can be. Imagine you’re a B2B software company based in the Flatiron District. By setting up goals for demo requests and analyzing the conversion paths, you might discover that users who read your blog are more likely to request a demo. This insight could inform your content strategy, prompting you to create more in-depth, industry-specific blog posts to drive qualified leads.
Bringing It All Together: Actionable Insights for New York Businesses
Now that we’ve explored the five main sections of the Google Analytics dashboard, let’s discuss how to turn these insights into action:
- Integrate Data: Don’t look at each section in isolation. For example, combine Audience insights with Conversion data to understand which demographic segments are most valuable to your business.
- Set Up Custom Dashboards: Create dashboards that display the most crucial metrics for your business at a glance.
- Use Segments: Analyze data for specific subsets of your audience to uncover deeper insights.
- Regular Analysis: Make data analysis a regular part of your business routine. The New York market moves fast, and so should your strategies.
- Test and Iterate: Use the insights you gain to form hypotheses, then test them using features like Google Optimize.
Conclusion: Empowering New York Businesses with Data
In the competitive landscape of New York City, data-driven decision-making is not just an advantage – it’s a necessity. By mastering the five sections of the Google Analytics dashboard, you’re equipping your business with the insights needed to thrive in the digital age.
As an SEO agency in New York, Cyber Munk is committed to helping local businesses unlock the full potential of their digital presence. Google Analytics is a powerful tool, but it’s just one piece of the puzzle. By combining these insights with our expert knowledge of SEO and the New York market, we can help your business achieve sustainable growth and success.
Ready to take your digital strategy to the next level? Contact Cyber Munk today for a comprehensive analysis of your Google Analytics data and a customized plan to boost your online performance.
Remember, in the city that never sleeps, your data is always working. Make sure it’s working for you


